Launch Pad, Day Three: Mike Brotherton on Everything You Wanted to Know About Stars...
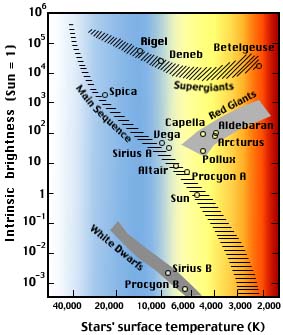
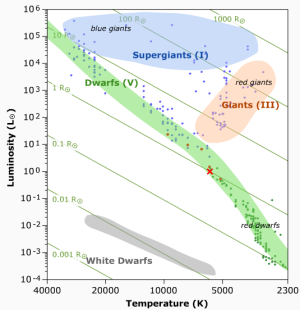
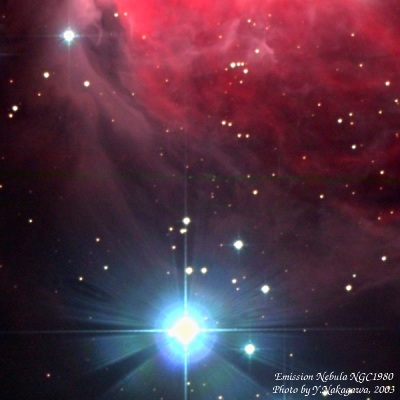
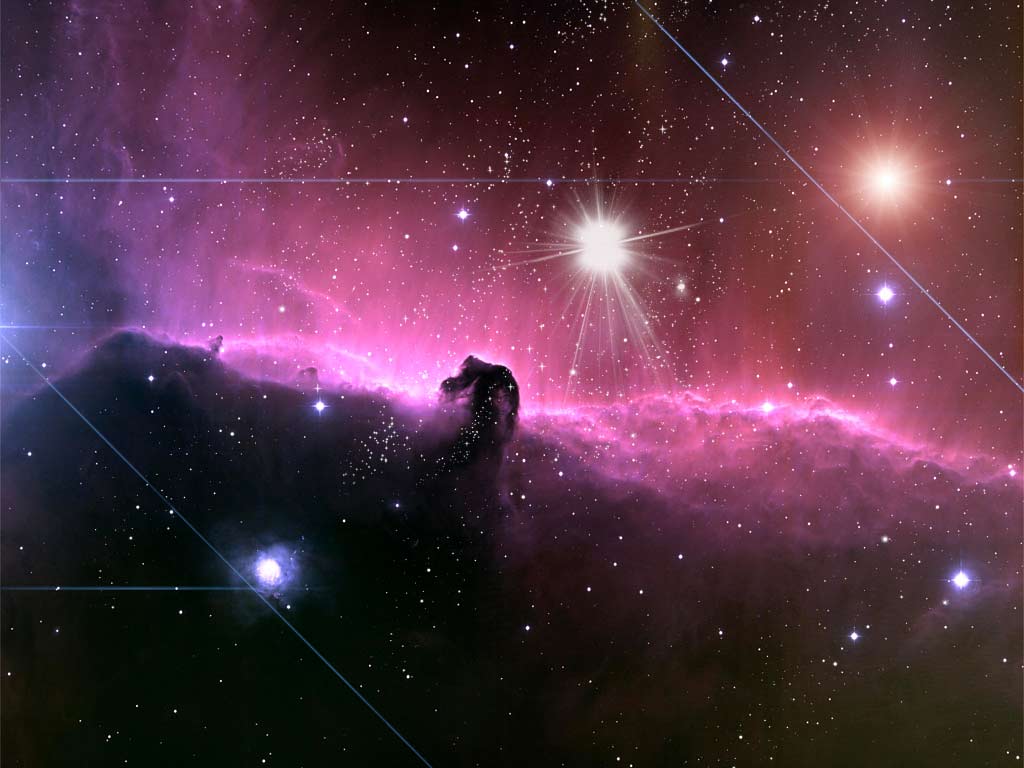
To see the rest of my launch pad posts, click here.Stars are the bread and butter of astronomers. They're the building blocks of galaxies. They're well-understood in the basics these days. You can go into the details, starting with the understanding that they're burning balls of gas, and we move from there to a detailed understanding of their chemical structure, lifespans, how they're born, how they die. There are some areas that are still active areas of research, but I'm going to go into a lot of stuff about stars today. I can't cover everything, but I'll cover probably as much as you can handle.The things we've touched in the past day or two should prepare you for understanding the initial things about stars. If we take a look at a star, what we see is something that looks like a black body spectrum with absorption lines on it, from helium, calcium, and some other elements. If you have a black body, then you have a dense gas, liquid, solid, at some temperature you can determine, and if it's got absorption lines, then it's got some kind of cooler, less dense gas between you and them. In this case, that's stellar atmospheres.So, by taking the spectrum of a star, we can already determine some profound qualities about it: temperature, chemical composition. You don't even have to know how close they are at this stage. You can know how hot they are and what they're made of.There's another way to get temperature and to understand how the absorption lines change as a function of the temperature of the star--the balmer thermometer. These are balmer lines, and they're what we saw in the lab yesterday through the spectroscopes. Those colored lines are transitions of hydrogen into the excited state N=2. We have to start with hydrogen in this excited state in order to see absorption in the balmer lines in the optical. If we had extremely cold hydrogen gas, we'd start off with the hydrogen in the ground state. The collisions wouldn't be as often or strong enough to knock the electrons into excited states. As we raise the temperature, the collisions between the hydrogen atoms will become more energetic and can provide the energy to move electrons from ground state into higher levels. In sun state, you get a very hot gas, the collisions are so often and so energetic, you don't have very much hydrogen in ground, it's all very excited or ionized and knocked into plasma. So if we're looking at balmer absorption lines, transitions where we absorb photons, we see that we start with initially most hydrogen at ground state and as you increase temperature, hydrogen becomes excited, and then as you increase further, it moves into even more excited states that aren't absorbing balmer lines. There's a sweet spot at about 10,000 K where a lot of hydrogen is prepared to absorb balmer lines.The temperature, 10,000, is a hot star, but not the hottest they get.If you see a star with really strong hydrogen balmer absorption levels, it's going to be about 10,000 degrees, and consistent with what you see in the black body shape. Even higher temperature stars, the balmer lines will get weaker, lower temperature the same. So baler lines themselves aren't enough to really give you a temperature because you can't tell if it's hotter or cooler than the peak.Similar things will happen with other elements--not balmer lines, but transitions in the visual spectrum you can measure. Titanium oxide absorbs at low temperatures. Calcium is a strong absorber at 5,000. Then, iron, then hydrogen (10,000), then at very high temperatures, you have excited levels of helium, an then ionized helium. The hottest stars will have strong helium lines and weak hydrogen lines.You can measure these and get a temperature and look at the black body shape and see if it correlates correctly, as a check. It's a relationship b/w the gas and the temperature of the star.What you should be anticipating now is that for stars with a range of temperatures we're going to see black body shapes changing, peaking from red to blue, and the absorption spectra will change.Spectral classification of stars--different types of stars show different, characteristic sets of absorption lines. Hot stars, lots of blue, not so much red. Cool stars, lots of red, not so much blue. You can also see the absorption features change with temperatures. (We're looking at a chart right now, which helps this make sense. It seems to be this one -- http://www.ngawhetu.com/Resources/StellarRadiation/images/kauf19_10.jpg-- for absorption lines, look at the black lines that interrupt the continuous colors.)Spectral classes of stars--from hottest to coolest--we have whether a star is red or blue and what absorption lines we see. For instance, Spectral class O has 40,000 K temperature, weak balmer lines, and ionized helium. B stars are at 20,000 degrees, medium lines, and neutral helium spectral features. Down the chart, you get like K which is 4500Kelvin, very weak balmer lines, and ionized calcium strong spectral features.Mnemonics for remembering stars in spectral sequence:Oh Be A Fine Girl/Guy, Kiss MeOh Boy, An F Grade Kills MeOnly Bad Atronomers Forget Generally Known Mnemonics(OBAFGKM)There are cooler stars, Real Soon Now (RSN) which aren't used as much, and a couple that are new, but not incorporated into mnemonics.Astronomers usually plot graphs of spectra, using wavelength on the x axis, and y is light intensity. (Chart like this but not colored.) This is a continuous series, stars would fill out all the places in between the lines on the chart.Our sun is a type G star.O-stars peak in ultraviolet. They are hot. M stars, cool, peak in the infrared. Everything in between, as we transition from blue to red. These don't quite look like black bodies, though O and B look similar to black bodies. The shape gets modified by the absorption. The details of these spectra are complicated, and you have to model the stellar atmospheres in order to really understand the absorption. Computer models can do that.So, why are the letters out of order, why go O to M? The way observational science starts to work I sthat when you first find something and start studying it, you don't have a clue. All you can do is collect phenomenology. You don't know what it is or why you're looking at it. So when people went to look at the star spectra, they were just studying them, and didn't know what they were. They therefore arranged them according to whim--in this case, according to the balmer lines--and so they rated the objects with the strongest balmer lines A, and second strongest B, and so on. And later, when the balmer lines were determined not to be a good way to organize the stars, the stars were reorganized by temperature, which put the letters out of alphabetical order.Absorption lines depend on temperature, but also on elemental abundance. So by studying the spectrum in detail we can determine elemental abundances. What's the sun made of? The sun is the easiest one to do. We get so much light from it, we can study it in great detail.When we talk about solar abundances, we use the sun as our basic metric. Are abundances super- or subsolar?We can talk about abundances by their percentage, or by their mass. For instance, 91% of the sun is hydrogen, or 71% by mass. The sun and pretty much every star we see is mostly hydrogen with a big chunk of helium, and everything else in some sense is a trace element. Stellar and extra-galactic astronomers focus on hydrogen, helium, and metals. Everything in the star is hydrogen, helium, or metals. They also talk about nebulas in terms of metallicity. You can look at what's in a star and figure out whether it was born early or late in the universe.We have seen almost every element we know of in the sun, except for some of the strange heavy ones, except for maybe gold.We know surface temperature, chemical composition. Now we need to learn to determine distance, luminosity, radius, mass, and how all the different types of stars make up the big family of stars.Distances to stars. Trigonometric parallax is one technique of calculating it, where the star is triangulated from two different angles. Unfortunately, stars are so far away that this is hard to do for the majority of them. Alpha centauri, etc, have a parallax of a bit less than one arc second, so we can measure that,... but at the same time one arc second is about the range of our seeing. So it's hard to do. We put satellites in space to try to measure the distance of stars, that's all they do. This method does not work farther away than about 200 light years from the ground, or about 1000 light years from space.If we know the distance of a star, we can calculate its intrinsic brightness, because we know how light fades with distance. If you move a lightbulb twice as far away, the light you receive from it decreases by a factor of four. The idea is that light spreads out in a sphere, and the surface area of a sphere is 4 pi r squared. So if you know how far away something is, and you know how bright it looks, you can figure out how bright it really is. You measure how many photons you get in your telescope over time and you can extrapolate to the whole sphere what's going out from the star, in all directions. Knowing the distance--how far it's spread out--you can get its intrinsic brightness, or its luminosity.We have to be careful about the words we use... for instance, Sirius is a very bright star, brighter than Betelgeuse. Betelgeuse puts out more photons per second, but it's further away. So we try to use luminosity to refer to how much energy per second is coming from that star. That doesn't depend on distance. How bright it looks depends on both distance and luminosity.The word we'll use for brightness is the flux, f. f is approximately luminosity divided by distance squared.Most constellations, the stars are all different distances, and some are more luminous than others. They may all appear the same brightness, but they have different intrinsic brightnesses.With distance and luminosity, we can calculate size.for instance:polaris has just about the same spectral type (and thus surface temperature) as our sun, but it is 10,000 times more luminous. Thus, polaris is 100 times larger than the sun. If it's the same temperature as the sun, but puts out 10,000 times more light, then its surface area must be 10,000 times larger, so you figure out the area of the star, and then can understand its relationship to our sun. This causes it's luminosity to be 100 squared, or 10,000 times brighter than our sun.Organizing the family of stars: the hertzsprung-russell diagram. we know that stars have different temperatures, luminosities, and sizes. to bring some order into that zoo of different types of stars, we organize them into a diagram of luminosity vesus temperature (or spectral type), which creates a hertszprung-russell diagramhere's one such diagram.stars have a huge range of luminosity. temperature has a smaller range, but luminosity is temperature to the fourth power. most stars lie along the main sequence (the black line that swoops from the upper left to the lower right), with most near the bottom right, and just a few near the upper left. there are handfuls elsewhere, not on the main sequence line, such as white dwarfs, etc.stars that are the same temperature as our sun, but much brighter, are much larger. that's where you get giant stars.we can draw lines of constant radius on this plot... stars on the main sequence are similar sizes, meaning maybe as much as a factor of 10 different on the extreme end. the sun is one solar luminosity, one solar radius. Some really extreme red dwarfs (still on the main sequence), it's only 1/10th the radius of the sun. if we go up the main sequence to hotter stars, we get some that are maybe 10x the radius of the sun. f,g, k stars, all about solar size, within factors of a couple. Here is a picture showing the sizes of main sequence stars.Moving outside the main sequence, you see much bigger differences -- rigel is 100 times radius of the sun, betelgeuse is 1000 times. and white dwarf stars are much smaller, like the size of earth or other terrestrial planets.Here's a chart with solar radii like the one we were looking at.How big are the sizes we're talking about? Mike put a video on for us that ably illustrated the matter:[youtube]http://www.youtube.com/v/HEheh1BH34Q&hl=en_US&fs=1[/youtube]Knowing a spectral class doesn't give us that much information about a star. It tells you the temperature, but it could be big or small. So we add something else to give us more information--the luminosity class. These classes are: Ia bright supergiants, Ib supergiants, II bright giants, III giants, IV subgiants, and V main-sequence stars.Things like hypergiants that appear in the video, like the pistol star we discovered recently in the galactic core, are extremely rare stars that appear on the very, very top of the hertz-randall diagram.Though, Mike recommends against infodumping this much information about stars into a story.Luminosity effects on the width of spectral lines. If you take something of a given mass and make it bigger, then mass and pressure have to be at equilibrium for it not to be shrinking or growing. Gravity at the surface of a big star is smaller because it's further away from the center of the star. So surface gravity (if you could land a spaceship there, which you can't) on a giant star would be much lower than the same mass star, smaller version. You have to balance gravity with gas pressure at equilibrium. For a giant star, the gas pressure where you're making your absorption lines, is small. And it turns out the width of these absorption lines depends on your gas pressure so one of these smaller main sequence stars has broader absorption lines. As you go to giant and supergiant, the width of the absorption lines gets smaller.Examples: our sun is a G2 star on the main sequence, or a G2VPolaris is a G2 star with supergiant luminosity, G2Ib.If you know the orbital period and the distance from the sun of a planet, you can figure out the mass of a star. If you know the orbital properties of binary stars, you can figure out the mass of each.More than 50% of all stars in the Milky Way are not single stars, but belong to binaries. You can watch some of them to see what they do. You say they orbit around each other, but technically they move in orbits around their center of mass. The center of mass, we can determine by watching over some time, and it's just like balancing on a seesaw. If the two stars are the same mass, they're equal distances from the pivot point. If one is much more massive, the center of mass will be closer to one. The more unequal the masses are, the more it shifts toward the more massive star.We can get masses of stars by measuring how they move in binary systems according to Newton's Law of Gravitation.Masses of stars in the hertzsprung-russell diagram. From Newton's gravitation you can derive Kepler's third. (P/2pi)squared=a^3/GM or M=(a^3 times four pi squared)divided by Gp^2For binaries, you can calculate the mass of each star after watching a while. There's no direct way to measure the mass of a single, isolated object. Once we have masses of stars in binary systems, though, we can assume that if we find an isolated star that has the same properties as one of a star in a binary system, they have the same mass.We talk about masses of stars in solar units. And as we look at stars in the main sequence, we can look at red dwarfs with one tenth of the mass of the sun, and the most massive ones on the main sequence are maybe 70 or 80 solar masses, but actually they are usually only 20-30 masses.Now there's no correlation in what mass a star will have outside the main sequence, but on the main sequence, it appears that the stars are lined up by mass.High mass stars have much shorter lifetimes than small mass stars. If mass is the fuel for the star... in order for stars to shine and stay hot and remain in hydrostatic equilibrium, they burn hydrogen or helium on the main sequence. They can stay on the main sequence as long as they have hydrogen in hteir cores. SO luminosity is the fuel consumption rate, mass is the fuel. If you know how much fuel you have an how fast you're burning it you, can you solve lifetime.A star has all the fuel it will ever have when it's formed, unless it's in a binary system and eats another star. Some stars go through phases when there's convection and surface gas is brought down into the core,. Some massive stars burn hydrogen into helium in their core, and then when they get massive enough can burn helium in their core ,and eaven heavier elements. Mike warns us though that this is cursory and the real thing is more complicated, but he will explain later.So why do huge stars with enormous masses (and thus fuel) live shorter than the smaller stars with less fuel? It's because the big stars burn thorough it faster. This isn't a linear function--the larger, much faster burning star, will burn out very, very quickly, compared to the smaller, slower burning star.An aside occurs as the class attempts to calculate an equation: Mike says that astronomers use what they call significant figures. That means that if they use rough numbers (accurate to, say, 2 places), they will only calculate it out to rough numbers (accurate to, say, two places). If they use very accurate numbers, they'll calculate more accurate results.So the sun lives 10 billion years. A star with about 10 solar masses lives about 30 million years. One with .1 solar masses will live about 3 trillion years. This equation gives you a good approximation of a star's lifetime, but the actual data may be shifted slightly due to other factors.More massive stars are more luminous.Surveys of stars. Ideal situation: determine properties of all stars within a certain volume. Problem: fainter stars are harder to be observe and we may be biased toward more luminous stars. Also, you may tend not to see rare things, like the really really luminous stars.Census of the stars: faint, red dwarfs with low mass are the most common stars. Bright, hot, blue main-sequence stars are very rare. Giants an supergiants are extremely rare. One reason that these are rare is because they don't live very long; they live through their fuel and blow up. The smaller stars stay around forever.Also, when you form stars, you tend to form more low mass than high mass stars.The sun is in the middle of the H-R diagram, but it's not a normal star-- to be average among stars, it would need to be a red dwarf.stars dont just form in random locations. typically we have giant molecular clouds out of hwich stars collapse. O stars and B stars, you can only find near regiouns of star formation. they can't move far away because they blow up befoehand. So we have OB clusters near regioons of star formation where the're born. Other types of stars will disperse, but the O and B don't have time before they die.The interstellar medium (the ISM) the space between the stars is not ocmpletely empty, but filled with very dillute gas and dust, producing some of the most beautiful objects in the sky. We are interested in the interstellar medium because a) dense interstellar clouds are the birth place of stars, and b) dark clouds alter and absorb the light from stars behind them. If there's a lot of gas between us and a star, we might think the star is further away from us than it is, when really it just looks faint because it's behind a screen of dust.Stuff between galaxies is the intergalactic medium (the IGM). In some places, there's very little out there, and it's closer to vaccuum. In other places, it's ionized, and it glows. The interstellar gas is typically hydrogen, though also helium and other trace metals. It glows pink/red because it's hydrogen. The dominant hydrogen line in the optical is red and so in star-forming regions, we'll see red-glowing hydrogen gas.What would it look like if you were actually sailing through a nebula, like ships in Star Trek? Not like they show it, says Mike. He says he'll find us a short video from Phil Plait illustrating this point later. One issue is that the gas is very diffuse, and it wouldn't look bright if you were in the middle of it. It's a feature that looks bright and intense from a distance.The kinds of nebulae:We have 1) emission nebulae (HII regions, ionized hydrogen regions)... a hot star illuminates a gas cloud; excites and/or ionizes the gas (electrons kicked into higher energy states); electrons recombining, falling back to ground to state produce emission lines. Here's an emission nebula.2) reflection nebulae: star illuminates gas and dust clouds; starlight is reflected by the dust; and the reflection nebula appears blue because blue light is scattered by larger angles than red light. The same phenomenon makes the day sky appear blue, if it's not cloudy. A reflection nebula.3) Dark nebulae: dense clouds of gas and dust absorb the light from the stars behind; they appear dark in front of the brighter background. They look like there's a void of stars, but really there isn't. Here's a picture of the dark nebula, Barnard 86. Also, this is how the horsehead nebula works.If you try to look at these nebulae through a small telescope, you may find that red nebulas look white, or that other effects occur. This is because of the mix of the physical science and the biological science--your eye doesn't detect color well in low-light situations, so it misreads the color of the nebula.Interstellar reddening--Blue light is strongly scattered and absorbed by interstellar clouds. Red light can more easily penetrate the cloud, but is still absorbed to some extent. Infrared radiation is hardly absorbed at all, compared to the blue and even red optical lights. Therefore, interstellar clouds make background stars appear redder.I wrote an article for kids aimed at explaining scattering a few years ago. It was never published. I should reproduce it online, just to cover the basics of how this works. It'd remind me if no one else.I'm curious how you can tell what kind of redness is occuring, when several different kinds of effects are represented by red? Mike says some of it is filtering information. If you can figure out what kind of spectral body it is through non-color-related information, then you can figure out that the star looks redder than it should be, and thus figure out how much gas must be there. He says that the doppler red shift causes objects' spectra to move toward the red, not necessarily to become red, just to move in that direction. Whereas gas filters out some of the blue light. So, if I understand correctly, you can distinguish rednesses by using other types of non-color calculations and by figuring out how the redness is occurring.Whoops, missed a slide there while typing the answer.Now, structure of ISM... the ISM occurs in two main types of clouds:HI clouds which are cold clouds (about 100 kelvin) of neutral hydrogen and moderate density (a few hundred atoms per centimeter), that can be as much as 300 light years across.And hot intercloud medium, which is hot (a few thousand kelvin), ionized hydrogen, low density (one tenth of an atom per centimeter), and can be so rarefied that it's like a vacuum; even if you were out there in a spacesuit, the temperature would be unlikely to bother you because there's very little heat energy. The gas can remain ionized because of very low density.For density comparison, avagadro's number gives us the number of atoms in 12 grams of carbon -- 6.022 141 79(30) × 1023The various components of the interstellar medium: the wispiness of the infrared cirrus reveals the turbulence of the interstellar medium. A supernova can cause shockwaves that ripple through the interstellar medium.Shocks triggering star formation. Dark clouds out there, a few hundred light years across, are at an equilibrium. Then a supernova goes off and you get a shockwave traveling through space and they can approach the cloud and shock the cloud, passing through the cloud, and causing the gas to condense and heat up. Shove the clouds, which were at equilibrium, and parts of them will begin to collapse and make stars. (A supernova shockwave goes out tens to hundreds of light years until it dissipates. Has one ever passed through where we are, asks Kelly Barnhill? Not in human history. We would have a bigger problem with the radiation from a supernova than from a shockwave. If it was close enough to give us a problem with a shockwave, then the neutrino reaction. Supernovas would be a problem at about a hundred light years. Normally neutrinos aren't a problem because they barely interact with matter, they can go through like 3 light years worth of lead without being stopped. But because there are so many emitted by supernovas, they would kill everything. It's actually neutrino emission that causes the explosion... if you want to know all the ways we can die from supernovas, then check out Phil Plait's Death from the Skies. Aftermath by Charles Sheffield)Another way to shock the cloud into collapsing to form stars would be if two clouds ran into each other. Ian asks are the clouds held together gravitationally? Yes. Which is why they're easy to collapse... but could also easily be blown apart.In some galaxies, you get chains of supernovas which help form the spiral arm features we see in some galaxies. (In turn these create more stars? Because of pushing the gases? I guess) It's self-sustained star formation...The contraction of a protostar... we call them stars when they get hot enough to start fusion in their cores. They start out somewhere very low and to the right on the Hertz-Randall diagram. They get more and more luminous as they contract until at some point the decrease in surface area makes them curve back down a bit. They're surrounded by gas and dust, which we think will form solar systems, but we have trouble seeing them because they're dark. We look at them in the infrared, which allows us to see through the dust, and also because they shine more brightly in the infrared.At some point the star "turns on", reaching a stable formation on the main sequence, and the radiation coming from the star will blow away some surrounding gas and dust, allowing us to see them at that point.Is this abrupt, asks Bud Sparhawk? Getting to that, says Mike.We know from theory and observation that the time scales vary dramatically when it come sto how long it takes for protostars to contract and enter the main sequence. The really big stars contract quickly, where quickly means hundreds of thousands of years. The M stars and K stars can take hundreds of millions of years to contract.Jupiter and Saturn are still contracting. They won't turn on fusion, but it's still evidence of how slow it is.For the sun, it would have taken about 30 million years.Evidence of star formation: nebula around s monocerotis contains many massive, very young stars, including T Tauri stars, which are strongly variable and bright in the infrared. We can plot the stars we see in these regions on H-R diagrams. Some of the massive stars will be on the main sequence when very young, while the less massive stars are still approaching it.We're skimming quickly over herbig-haro objects, which seem to be jets of material shooting out of protostellar objects, but I should probably actually look it up in more detail on my own. The jets seem to be about as big as our solar system, and they move out into space.Globules are evaporating gaseous globules, or EGGs, newly forming stars exposed by the ionizing radiation from nearby massive stars.We're stopping here, so that next time we'll be talking about the evolution and death of stars, and stellar energy and fision.Now a side note on computing in astronomy: most physical sciences like astronomy are technologically diven. Computers are as much a part of that as things like the telescopes and the ability to launch craft into the atmosphere, and so on. Computers let us analyze the data, and handle the data rates. Computers control how fast we can do these numerical simulations. As long as moore's law keeps letting us go faster and faster, we can do a better and better job. As soon as moore's law turns around, astronomy will slow down, especially on the simulation side. Most astronomers have to be very computer literate and must be able to program at some level or use sophisticated software to attack problems, whether it's going from raw data to process and analysis through the computer, or using numerical simulation that has systems of equations that are too difficult or impossible to solve analytically. A lot of jobs today, we're sitting in offices working with data, figures, analysis, models on computers. It's going to kill me if I see another commercial or movie with a working astronomer at a lab in a lab coat, looking through the telescope. We sit in control rooms, surrounded by computers. We have data coming from instruments, but those are also mounted on computers, and are computer controlled.He's going to compile some research links for us, and also give us some online computing and research links that astronomers use. Some of them we won't want to use ourselves, but we should look at them so that we can use them in stories for our astronomers to use. Astronomers don't just point their telescope at something, take a picture, and get a gorgeous poster out of it, they use programs. Most astronomy papers are available for free online, so you don't always have to have expensive subscriptions to find exciting info. Some papers you probably won't be able to decipher, but some you can. Often press conferences and science conferences are also live streamed so you can get that information the way that science reporters and professional astronomers do.There are also data archives going online that are useful to scientists and amateurs, like NED (nasa extragalactic database), the SLOAN digital sky survey that's taken lots of pics of a quarter of the sky and spectra of a million objects, galaxy zoo which has pictures of galaxies that can't be categorized by computers so they crowd-source it to humans who can more easily identify the galactic types, space telescope that gives you access to data from many missions. You're probably not equipped to study the raw data, but a lot of them have access to the processed data. There's something called the national virtual observatory where you can pick a part of the sky and get a picture of it, information from many different astronomical surveys about that part of the sky. There are all these planetarium softwares and interactive tools that give three d maps. Some are sophisticated enough that you can put yourself in other star systems and see what constellations look like. That's the kind of detail that makes a really nice bit of science fiction. Could Sol be the key point in some new constellation?This is not the astronomy of the past. Some students learn to be astronomers by trekking out to telescopes--but more often they analyze data from the internet. Many astronomers today do not use telescopes directly (though many still do).So, he's going to give us a list of resources, annotated with information about how these will be useful to writers.Ian asks, Are Jupiter and Saturn still contracting at appreciable rates? Mike says a lot of the radiation coming from them--50%--is not generated by the sun, but is coming from the energy released by their collapse. If they were out in space, away from the sun, they would still release energy. This will take billions of years to complete.Ian asks Kevin, do you have to deal with the rate of contraction when you're working on the probes? No, it's not significant.Kevin Grazier points out that data is plural of datum. Mike says that this is something they try to impress on the students.